Executive Summary
TextCraft delivers a framework with user-friendly interface to analyze and visualize any text corpus making it a versatile asset for unstructured text analysis. TextCraft is unique in the way that it is scalable, robust and easy to interpret, thus making it seamless even for user having minimal background in dealing with text. It uses various natural language processing algorithms in the backend, which are easily configurable, producing accurately tailored results. The content is very visual and dynamic for any user to understand the effective topics and sentiments in a text corpus. One of the many possible use cases for this tool could be for business owners to potentially make business strategies and decisions based on customer review sentiment captured by this web application.
Introduction
Like the commonly used machine learning quote goes, "Treat your data like a product, not as a project", this web application was envisioned as an asset for users with little or no background understanding of dealing with text data. The dynamic nature of this app allows for a user to perform text analytics, mainly topic and sentiment analysis, on any text data.
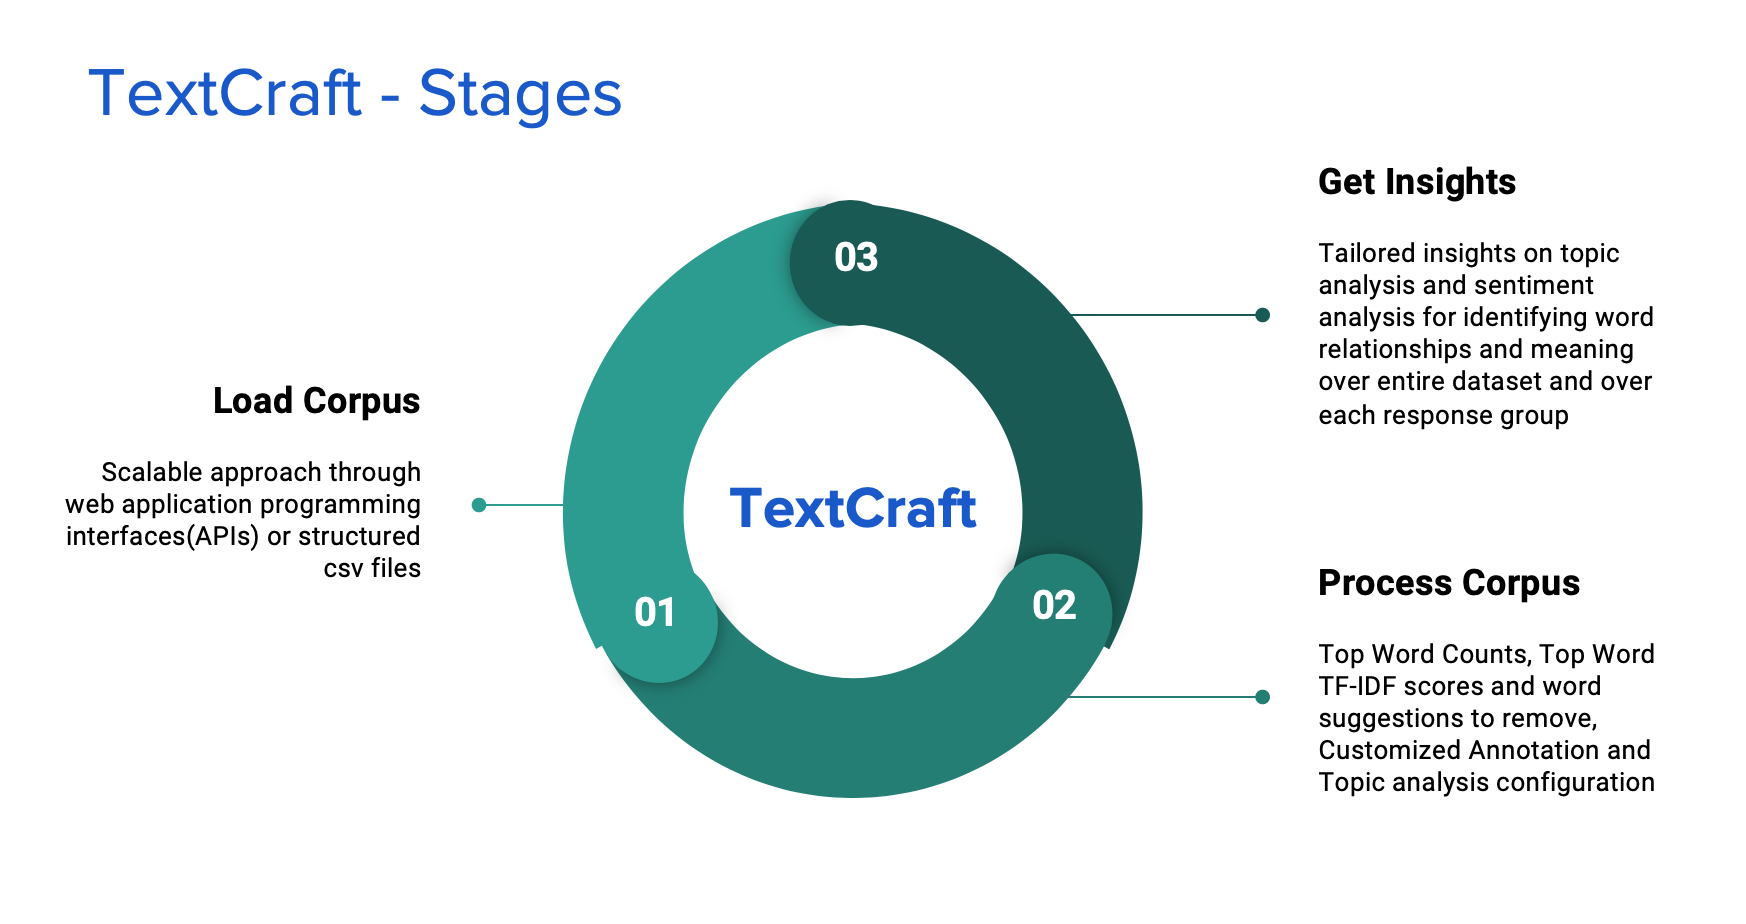
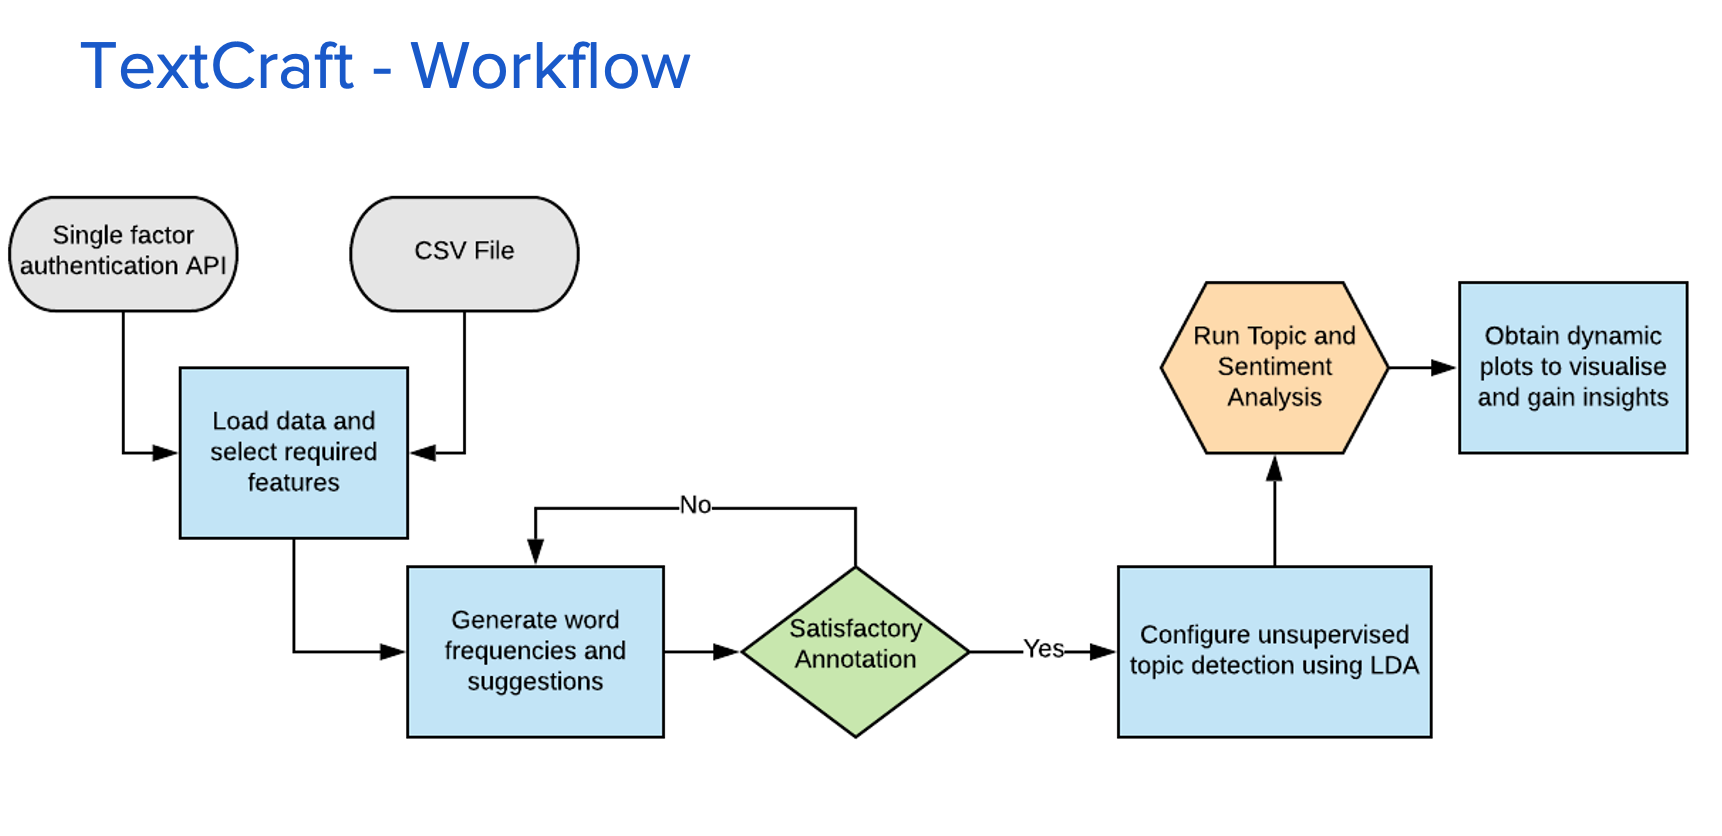
The app works in three stages:
1. Load Stage
The user gets to upload data in a csv file or hit Application Programming Interfaces(APIs) to fetch data into the tool. The user gets to see a preview of the collected data and decide the field that becomes the response and the field on which text models are applied.
2. Process Stage
This is the stage where data cleaning and modelling takes place. The user gets a glimpse of general summaries of the dataset like the TF-IDF scores, frequency counts etc. The user gets to annotate the word collection accordingly. The tool also allows the user to try different configuration parameters for running various models.
3. Insights Stage
This stage displays a set of tailored charts and visuals corresponding to the configured outputs for the user to make sense of the data. The plots are grouped by each response field categories making the analysis more granular and comprehensive.
Dashboard Design and Implementation
Home Tab
The front end interface is also laid out in the three-stage fashion of the app's architecture for ease of interpretation. The first tab is the home page which comprises of the introduction to the tool and the instructions to use it.
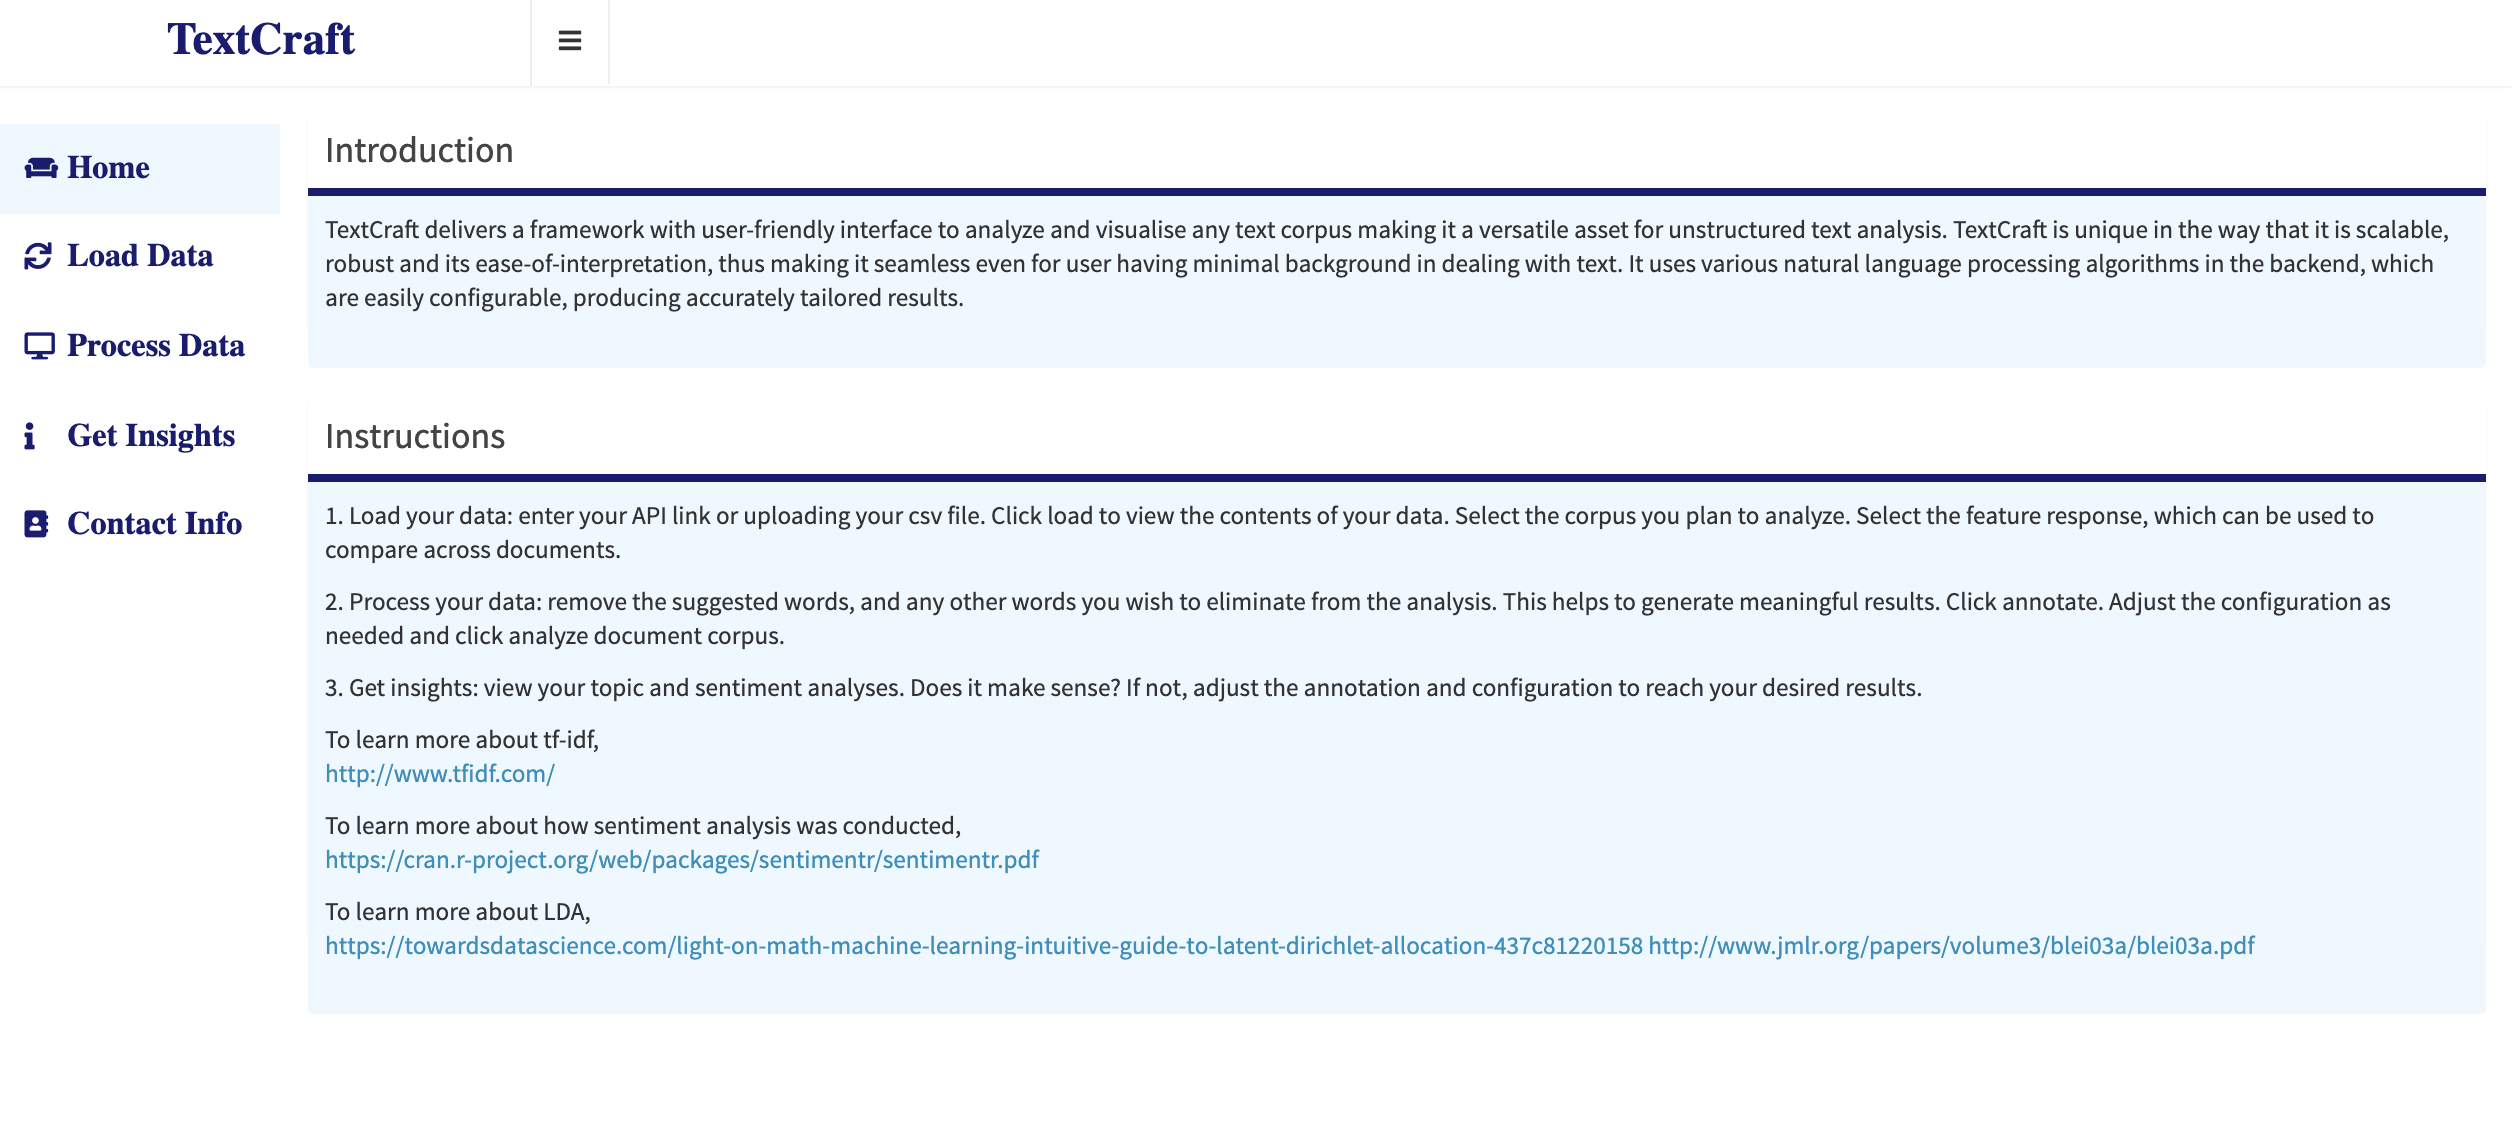 Home: Landing page of the app
Load Data Tab
Under this tab, the user gets to upload a CSV file with the data or enter an API link which provides access to a json scipt of data. The json from API is automatically converted into a dataframe in R, The fetched data is previewed on the lower part of the screen. The user then decides with field becomes the text corpus and which field would categorize the text as the response variable. Though, the user can select a single response field at a time, this field can be changed to redo the analysis. For reference, let's load a dataset containing the reviews for cirque-du-soleil shows in held in Vegas. The show names becomes the response and the reviews become the text corpus.
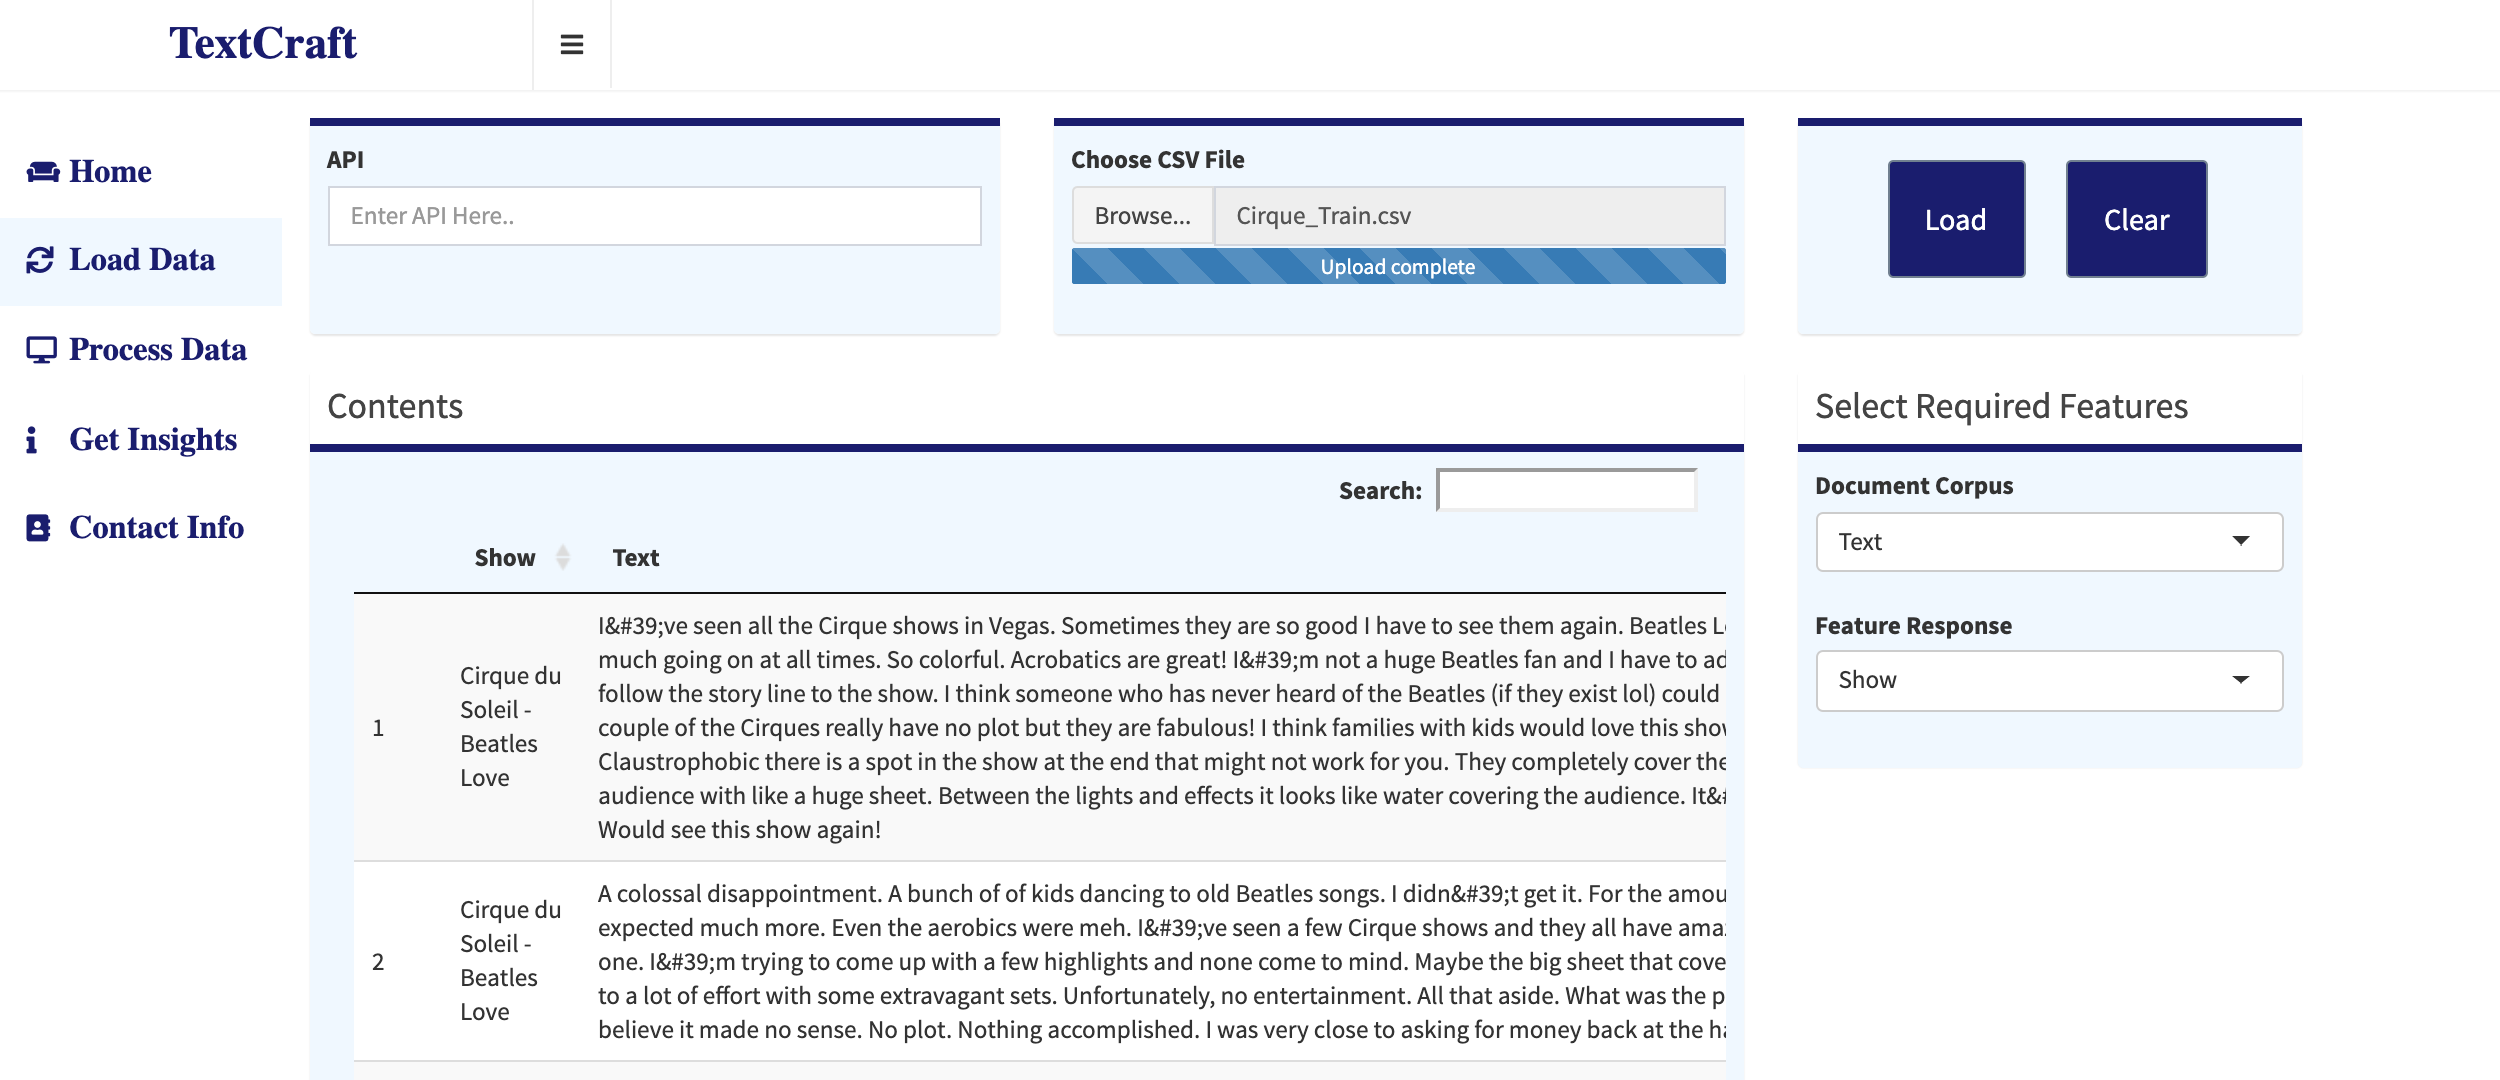 Load Data: The user uploads a CSV file or enters API link
Process Data Tab
This is the main tab where text is analyzed and models are initiated. At the top of the screen, the user gets to see the top 10 words with their word counts, TF-IDF scores and the suggested words to remove. Suggested words to remove are defined by a collection of conditional statements, depending on the word frequency, their TF-IDF score and their correlation with the title of the responses. The Annotation part allows the user to select the words to remove or enter a specific word. The user also has the ability to reset the changes to the original form.
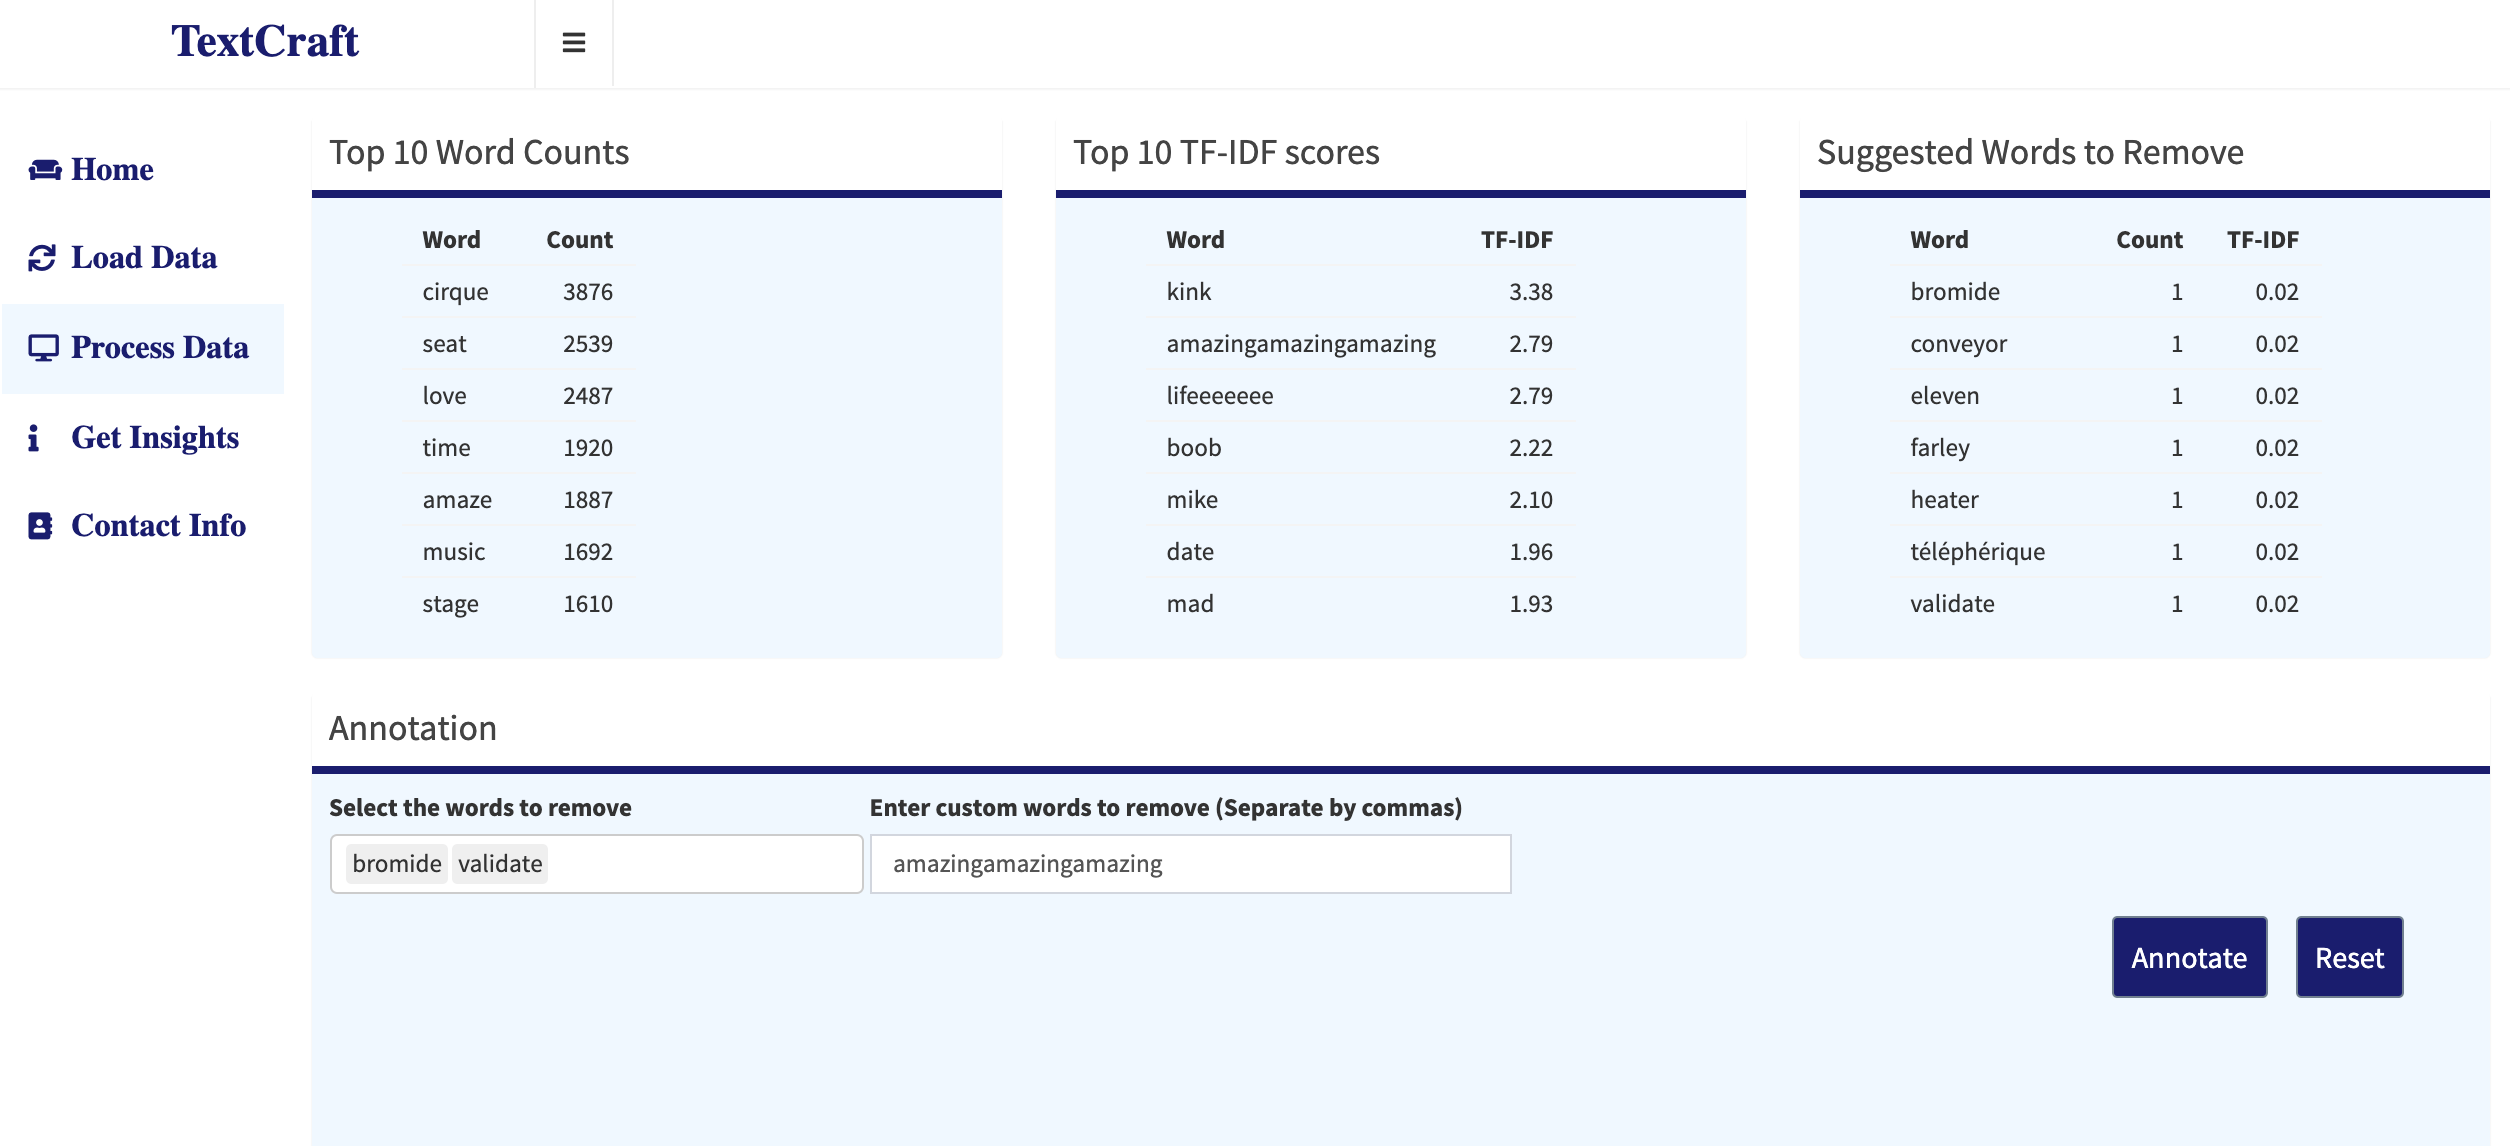 Process Data: Words selected and entered for annotation
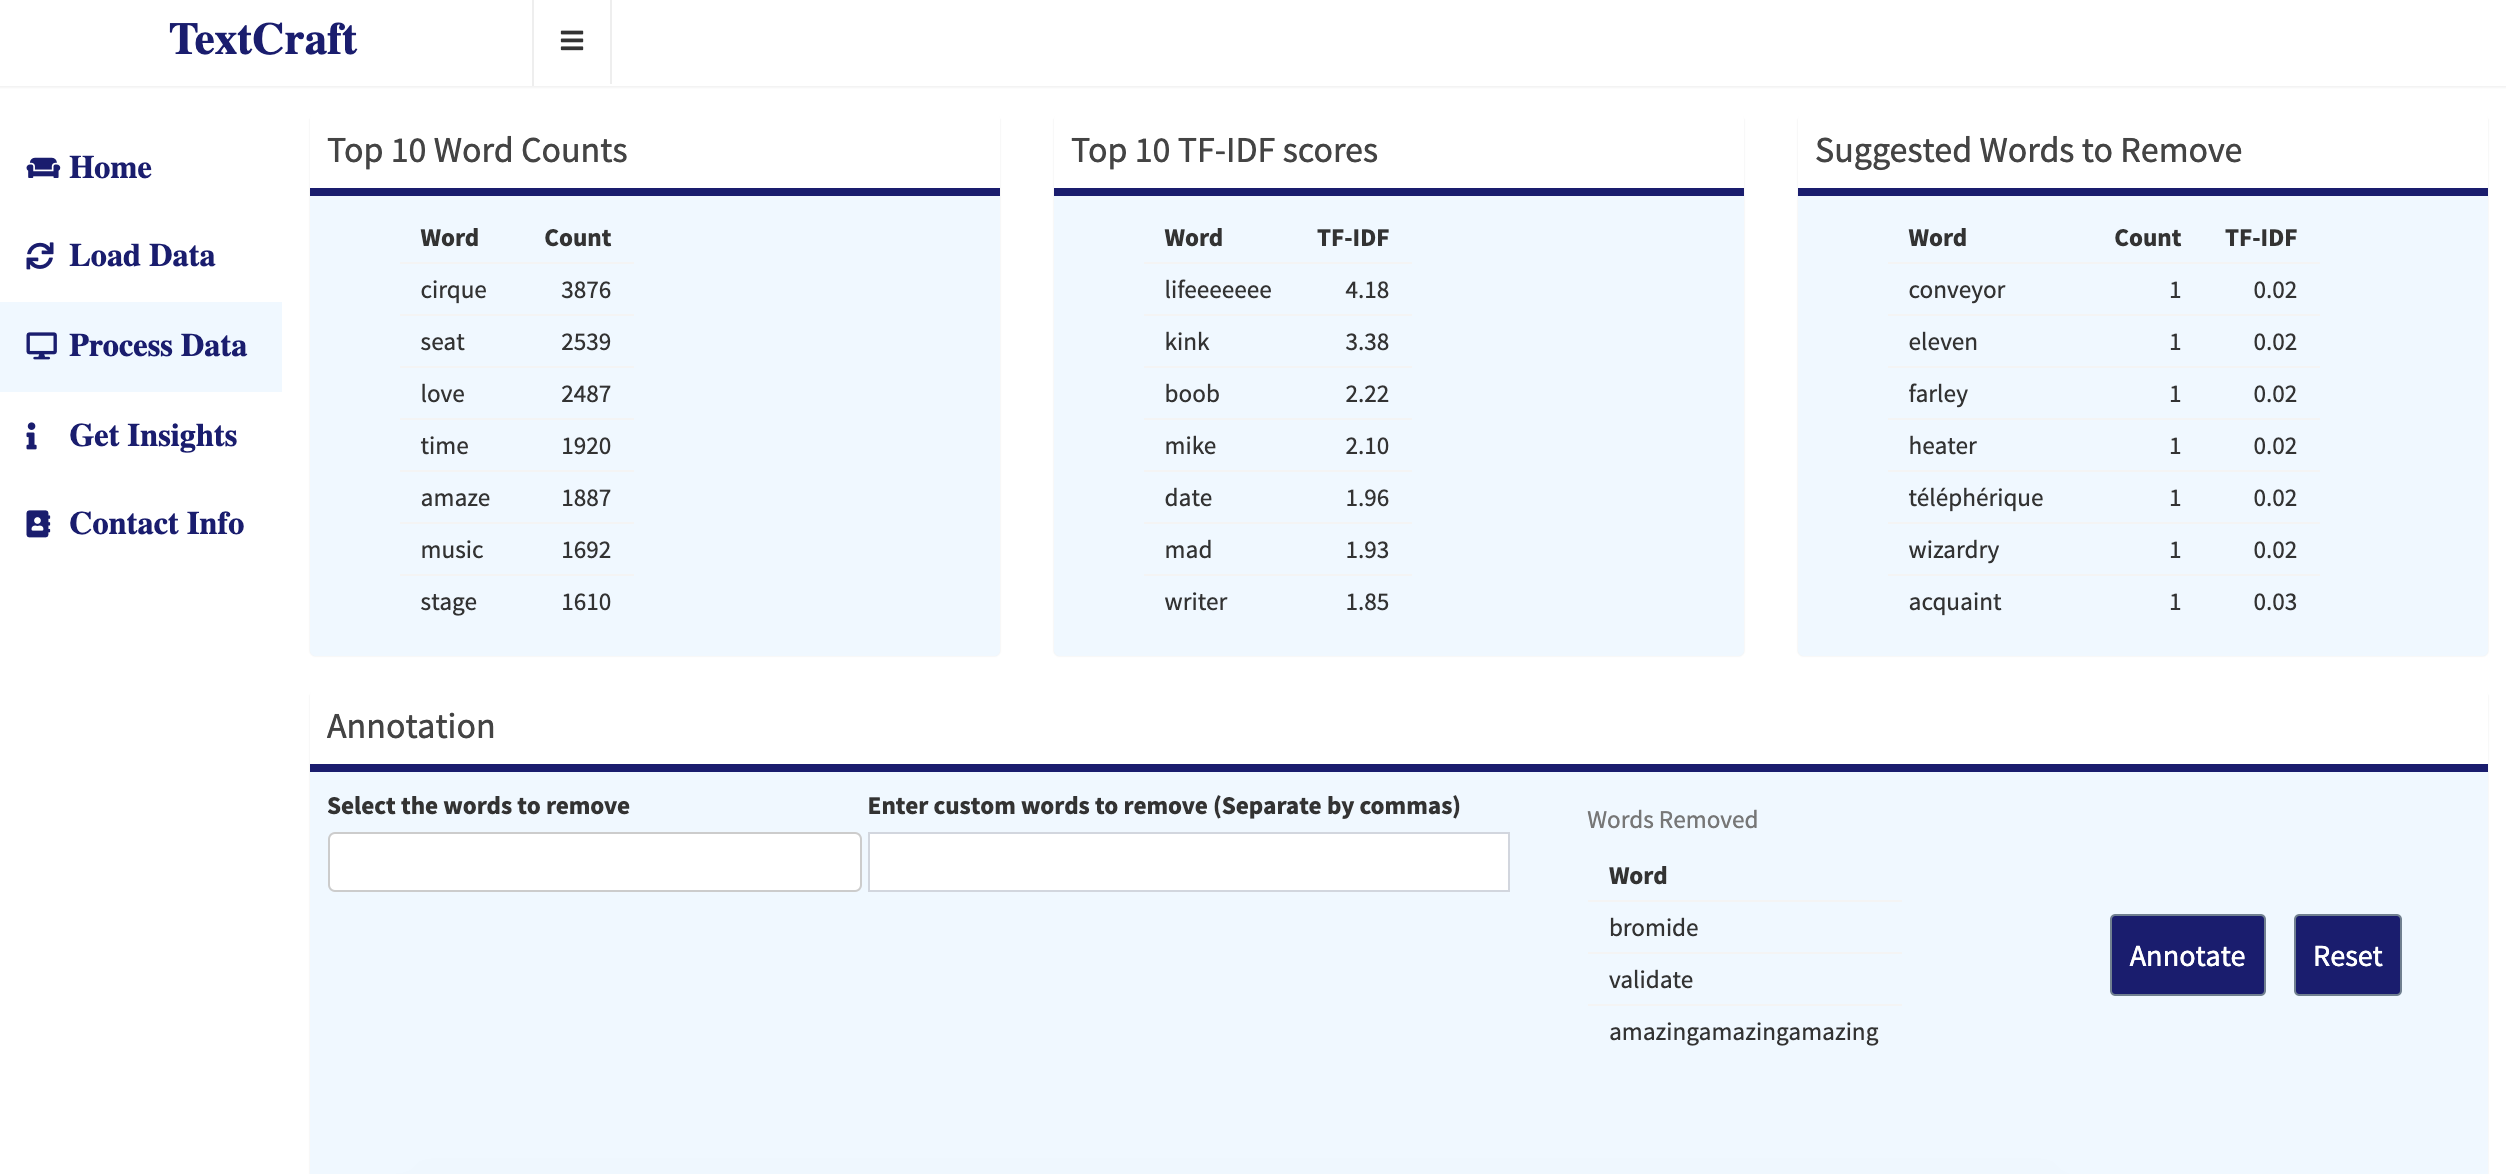 Process Data: Selected words are removed from corpus
Once the redundant words are removed from the corpus, the app runs two main models - topic and sentiment analysis. For the topic analysis part, Latent Dirichlect Allocation (LDA) model is used in an unsupervised fashion to identify the most matching words for a particular topic. The top TF-IDF scores with respect to each response category is also obtained in the backend. The user is allowed to change the model configuration parameters like the seed value, number of topics, number of words per topic etc. The user also can perform the text tokenization in a unigram or bigram method, which basically refers to the number of words per token. For the chosen example, let's choose unigram modeling showing top 7 words and running LDA for 4 unsupervised topics. Clicking on 'Analyze Document Corpus' initiates the process.
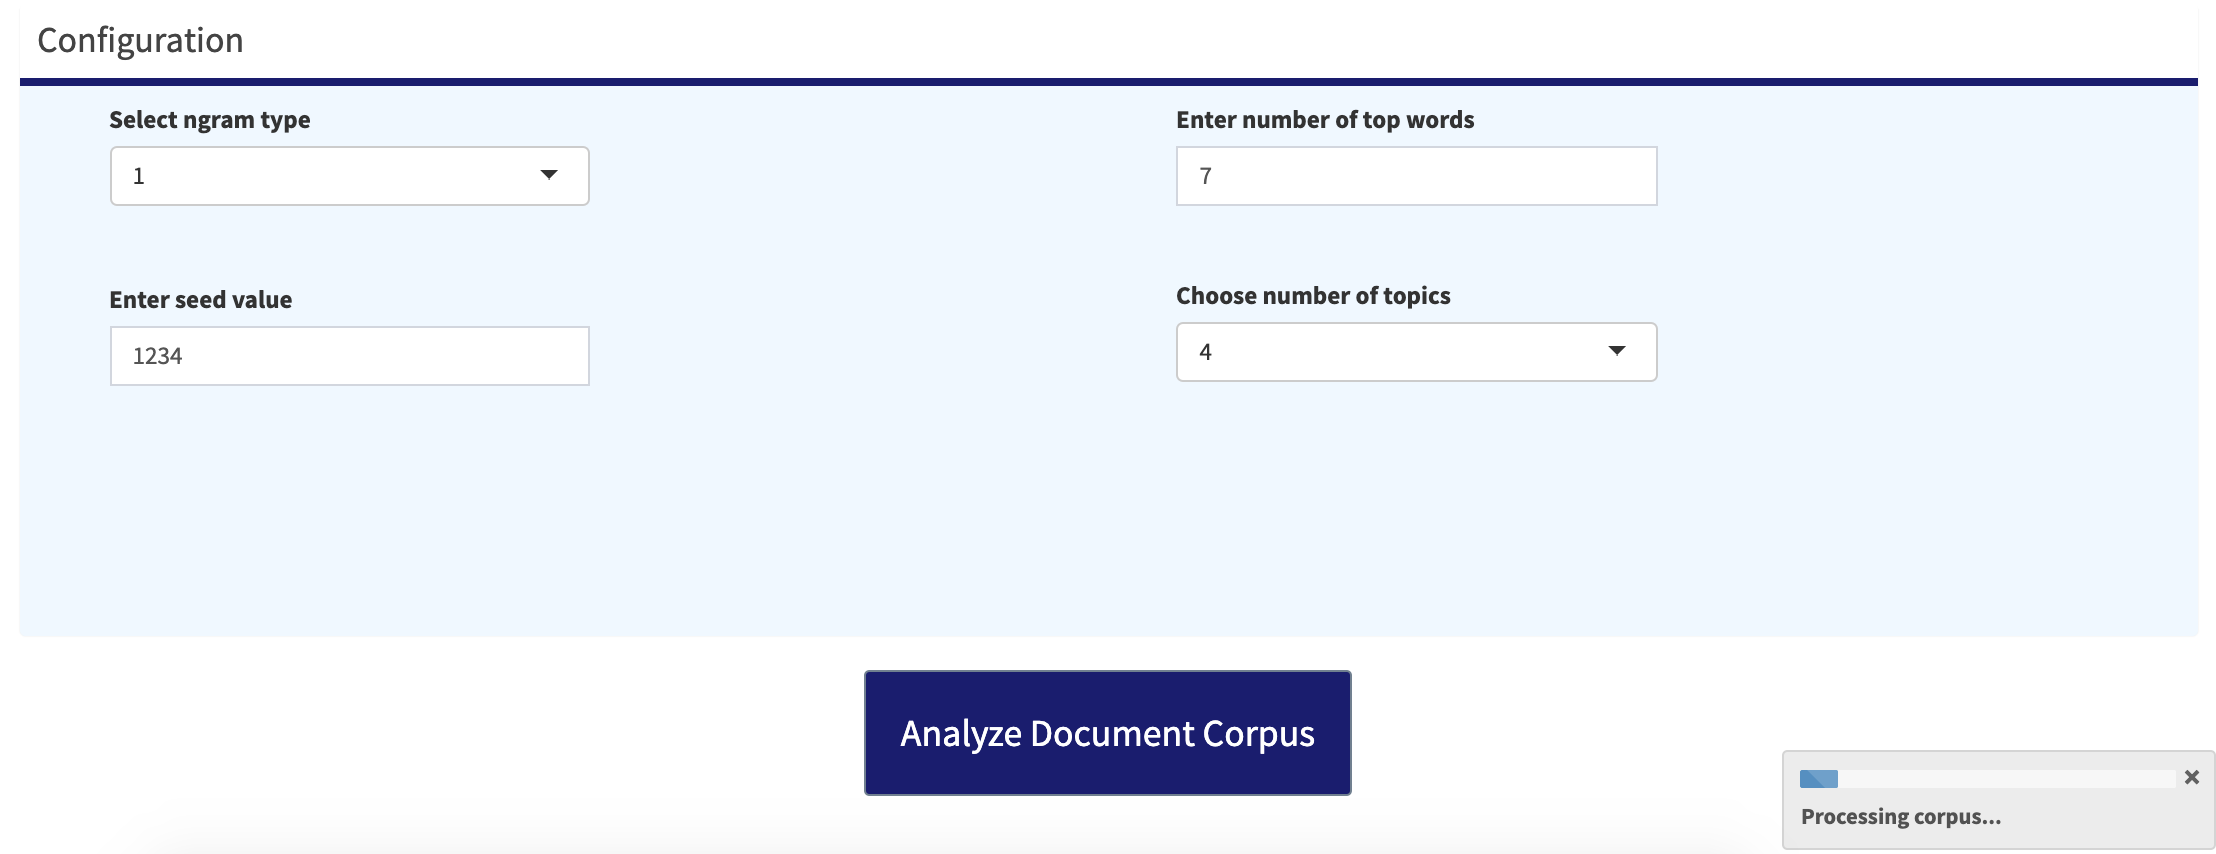 Process Data: LDA model configuration options
Get Insights Tab
The model takes a little while to run before producing the analysis results. The Get Insights tab comprises of two sub-tabs topic and sentiment analysis. The topic analysis shows two main plots. The first plot describes the grouped categories in the response field and the top words corresponding to that category. The bottom chart is the output from the unsupervised LDA model associating/clustering the words in each of the topics. The number of topics and the number of words displayed per topic is fed under the configuration part in the Process Data tab.
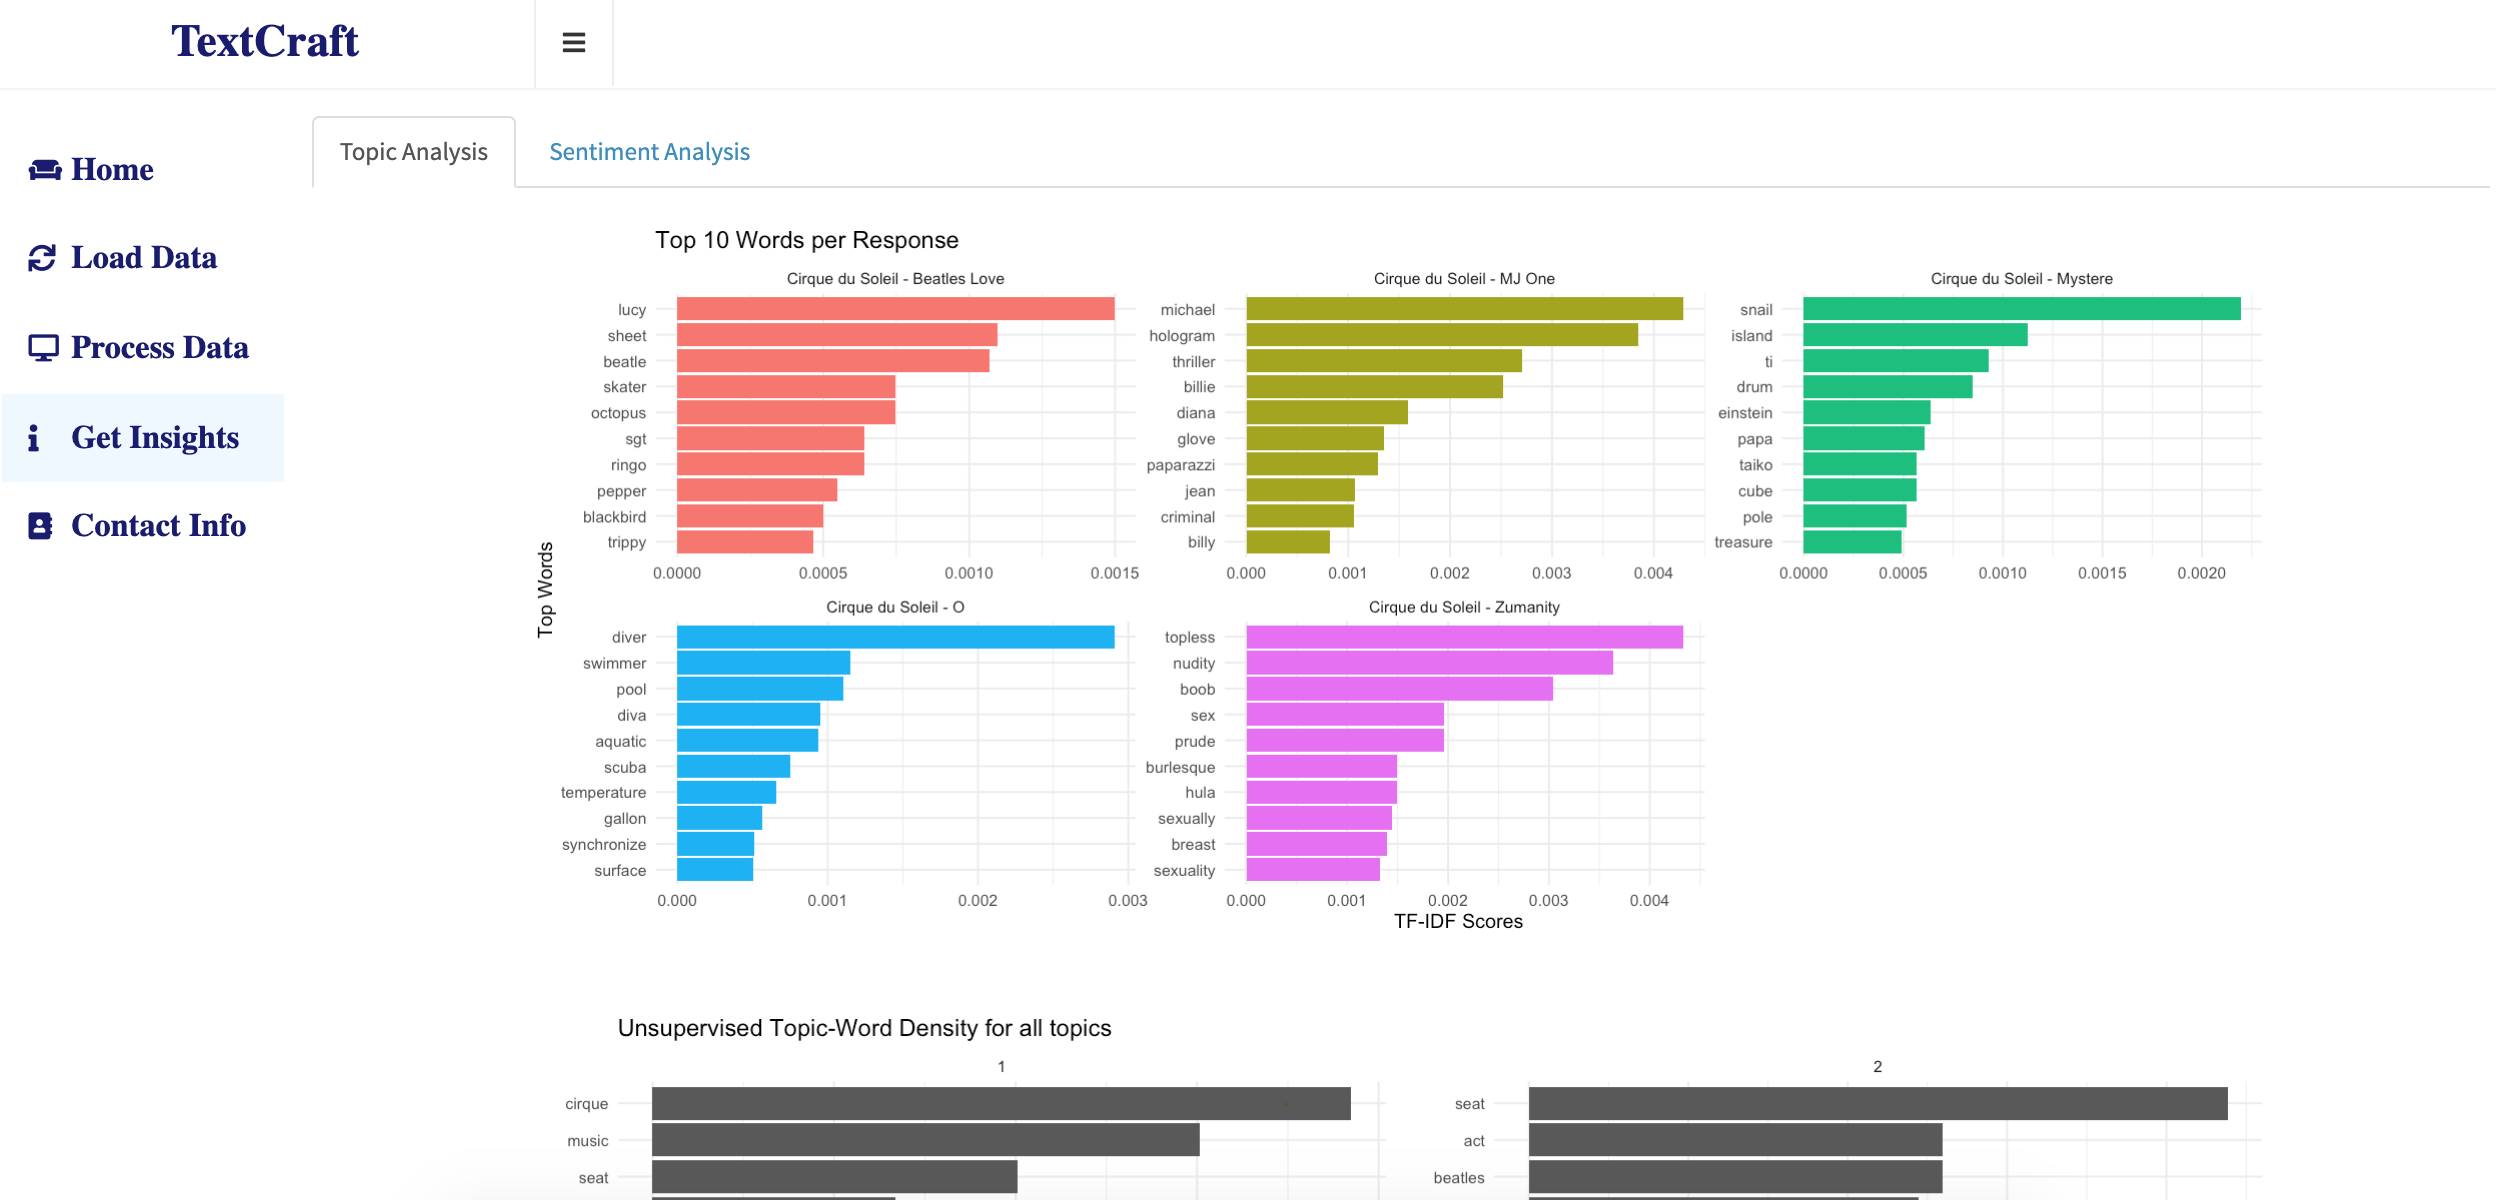 Get Insights: Top words for each response/show
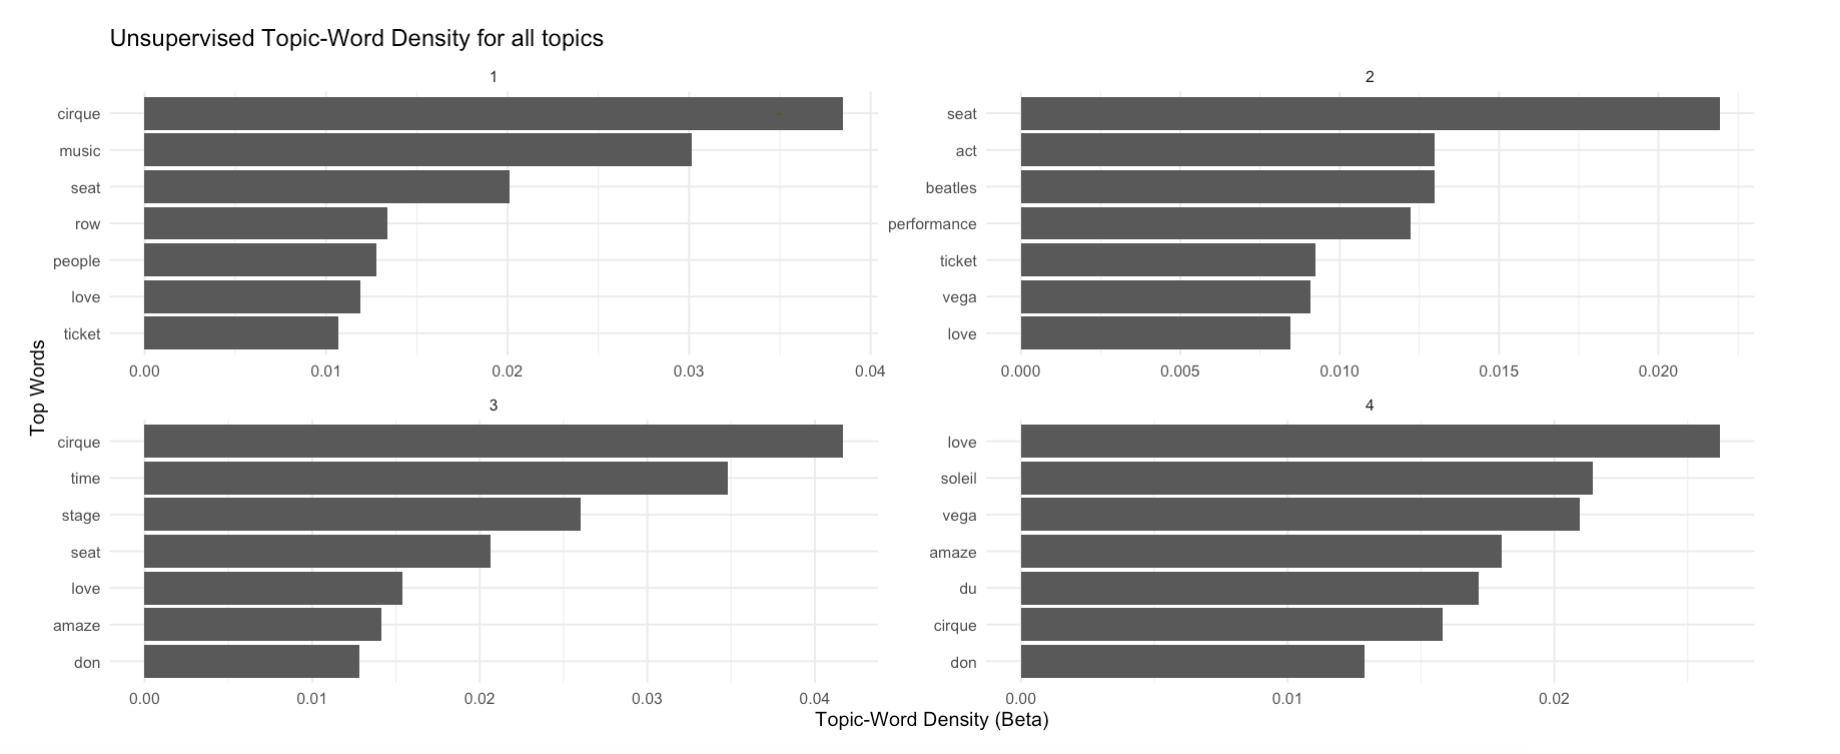 Get Insights: Unsupervised topic analysis from LDA model
The sentiment analysis sub-tab comprises of all the sentiment and emotion distribution in the entire corpus and also grouped by each response category. The package 'sentimentr' from cran is used for this part of analysis. NRC Lexicon for identifying the emotion of a word is used to associate the review context with emotion. The plots below show the distribution of emotion in the entire corpus and the emotion for a single show - MJ One.
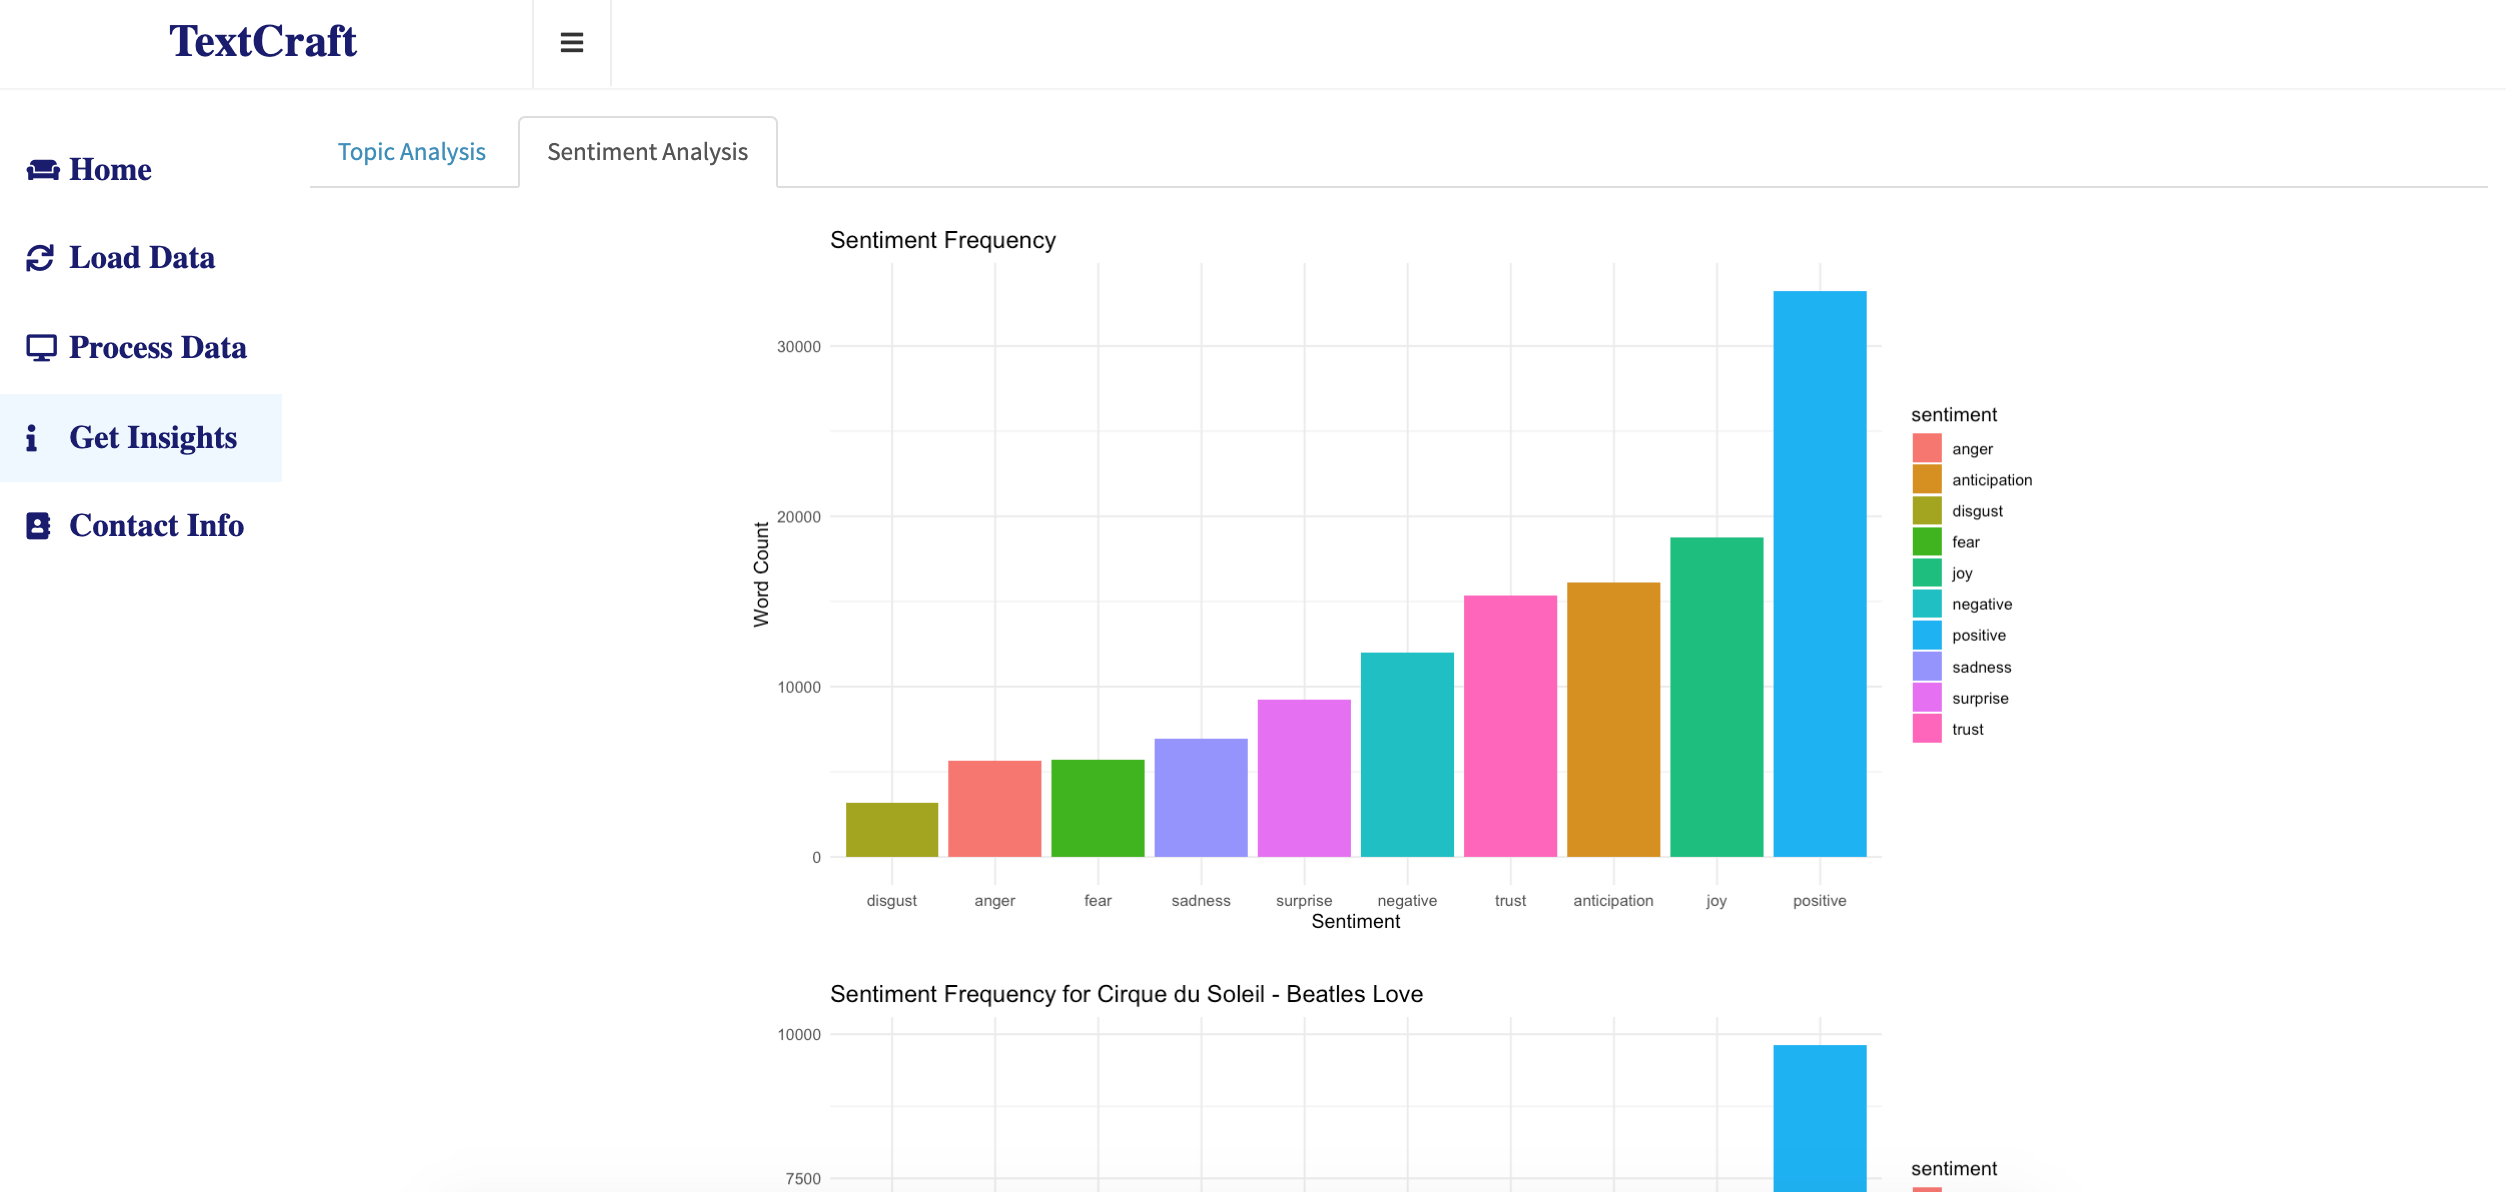 Get Insights: Emotion distribution across entire corpus
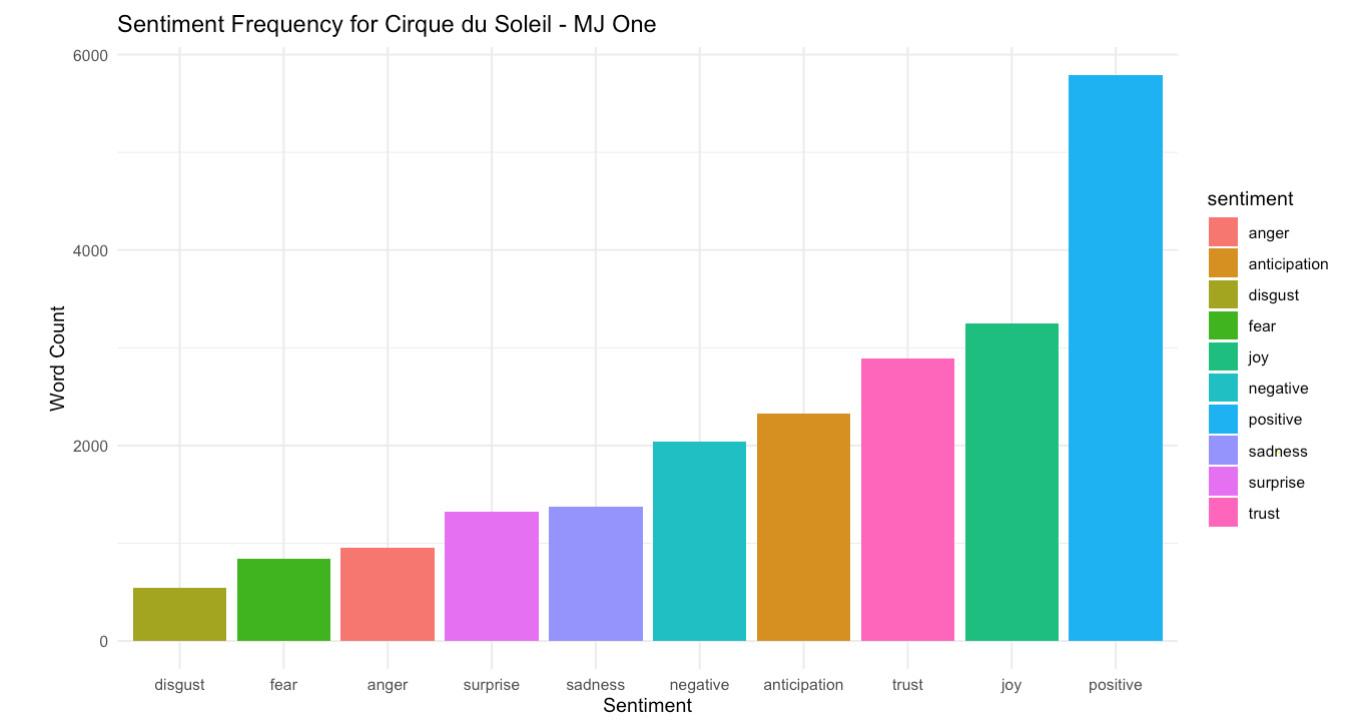 Get Insights: Emotion distribution across the show - MJ One
A sentiment score is used to as a measure to identify the general sentiment. The score distribution is analysed at various levels and its mean and standard deviation is calculated per response group. Following plots show the results of this analysis.
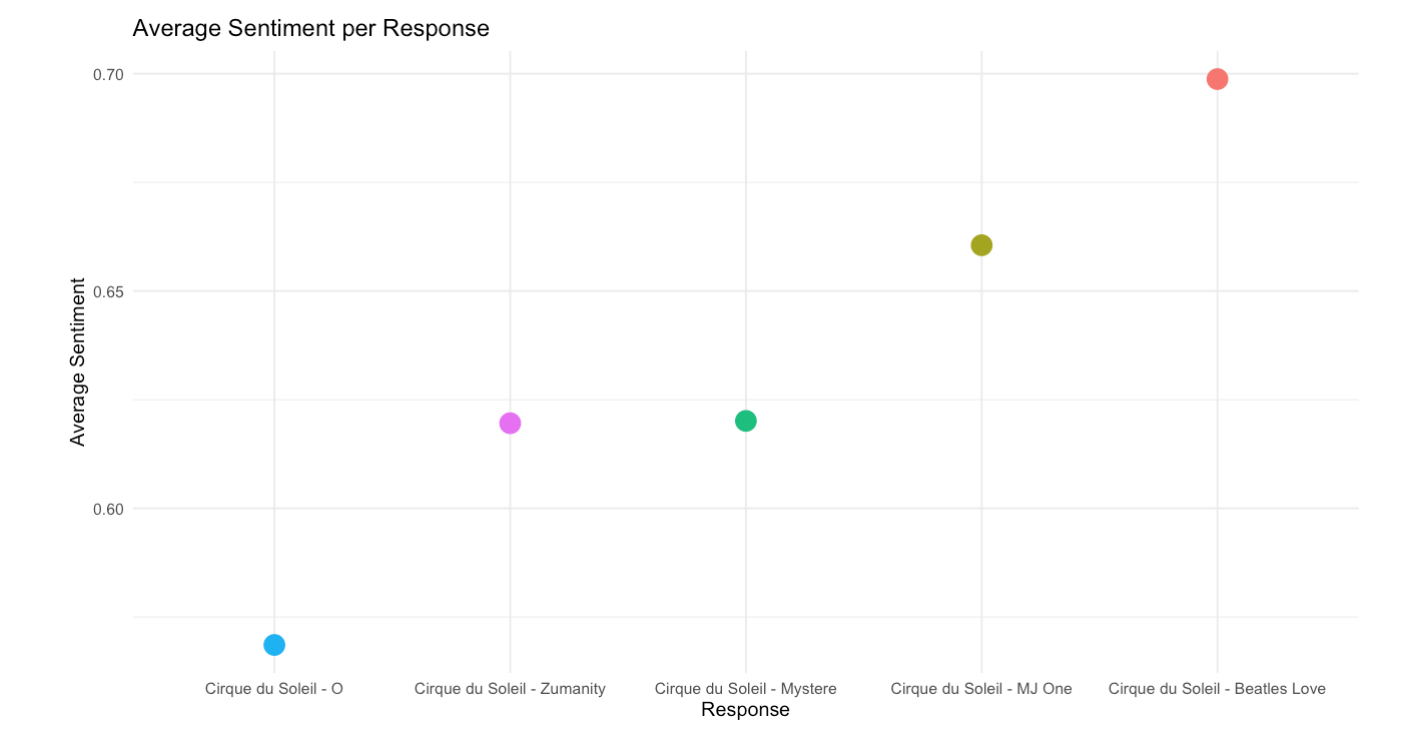 Get Insights: Average sentiment distribution for each response/show
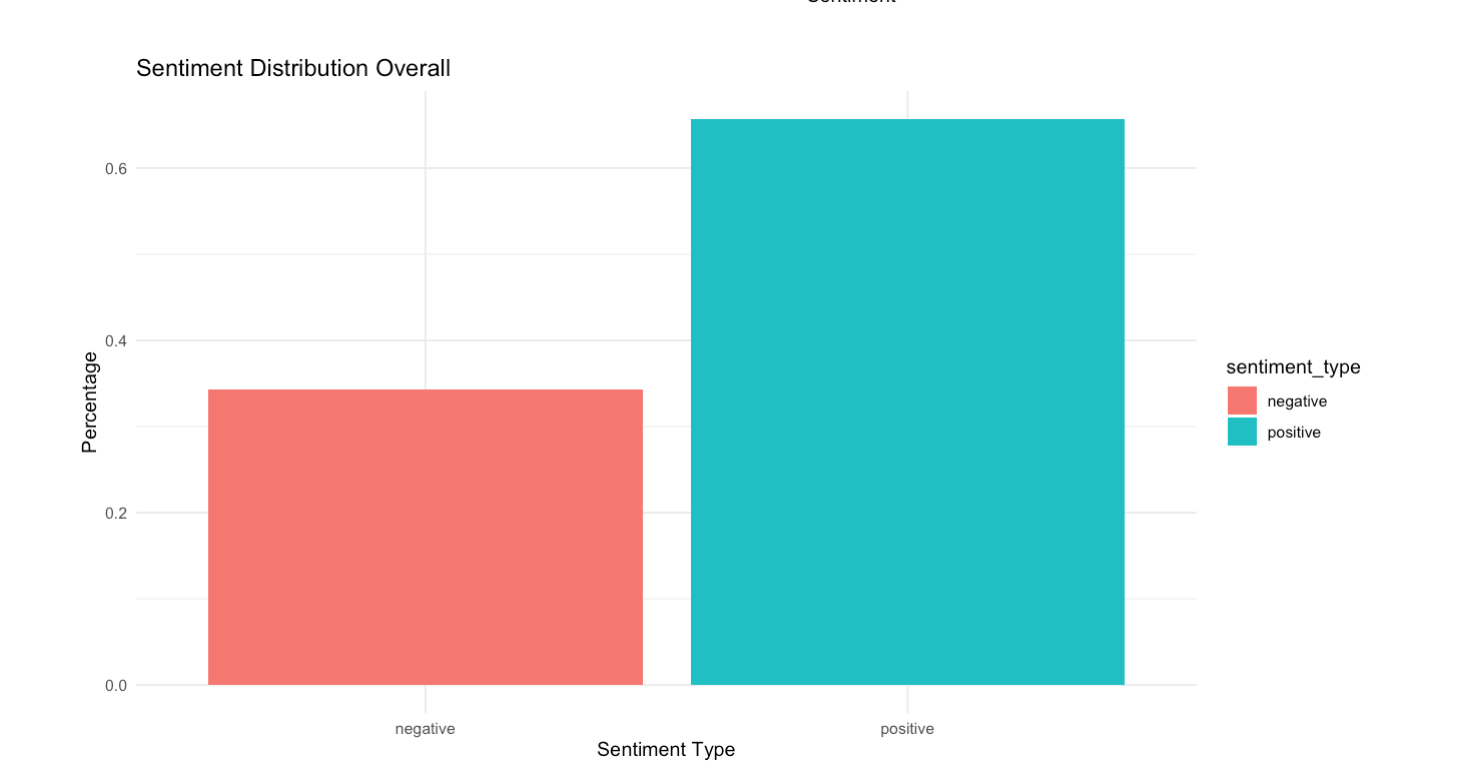 Get Insights: Positive/negative distribution across entire corpus
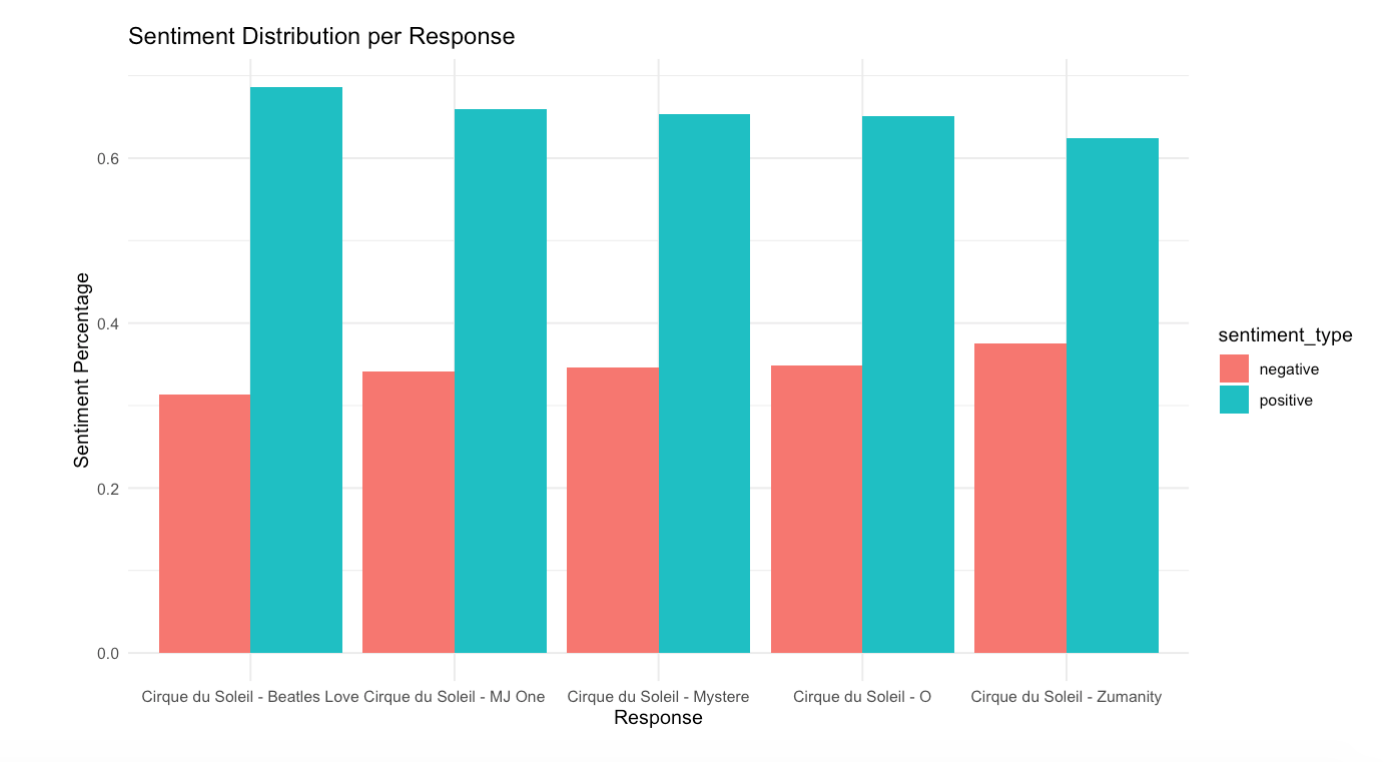 Get Insights: Positive/negative distribution across each response
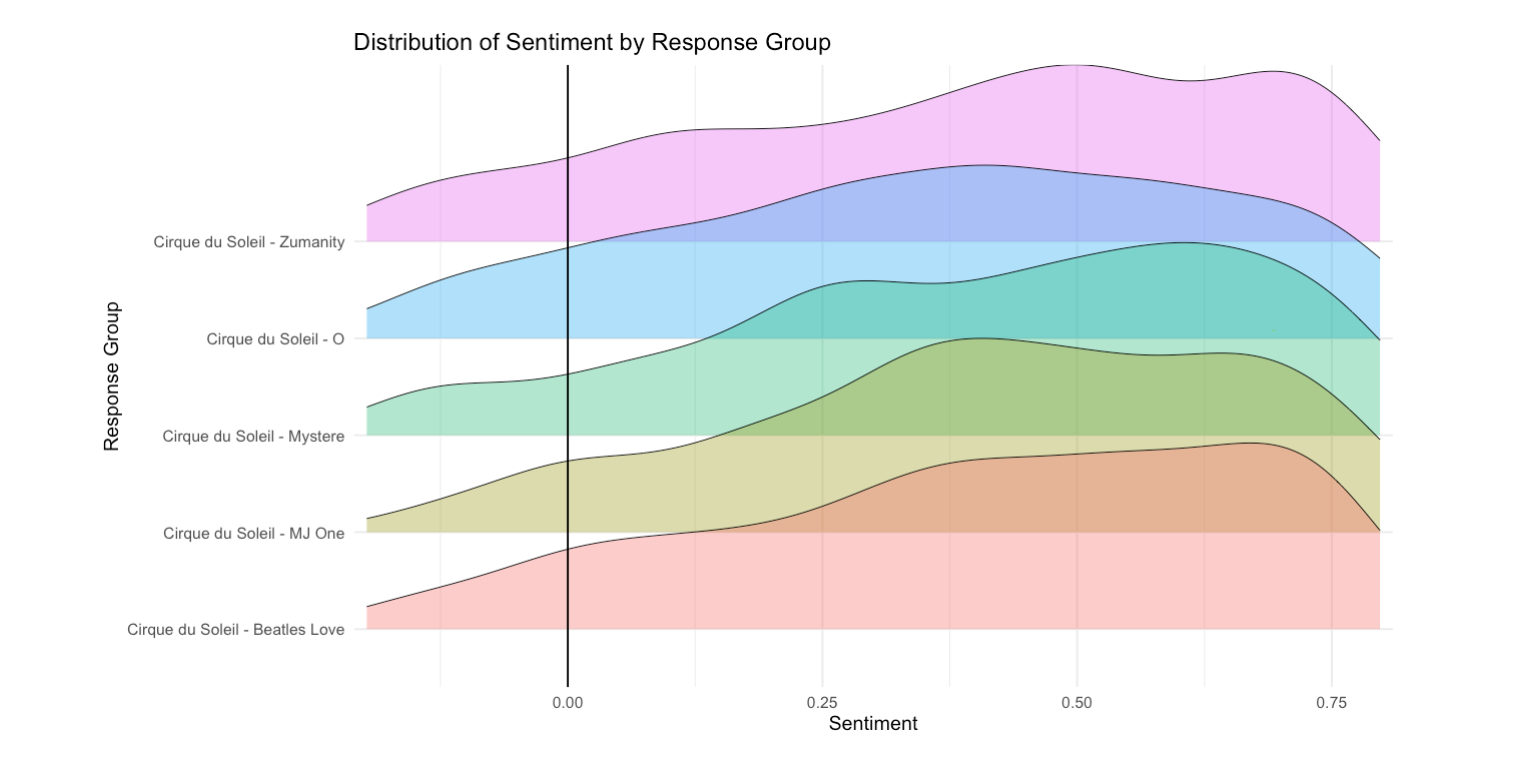 Get Insights: Statistical representation of sentiment score per response
References